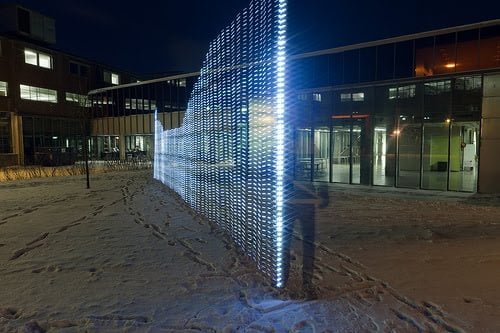
How does wifi signal looks like as it travels trough the air? the people over at this website came up with a genius idea to show it.
This project explores the invisible terrain of WiFi networks in urban spaces by light painting signal strength in long-exposure photographs. A four-meter tall measuring rod with 80 points of light reveals cross-sections through WiFi networks using a photographic technique called light-painting.
Translation: They take a long exposure photograph of the environment while walking with a 4 meter rod with 80 light bulbs that react to wifi signal, the result is pretty awesome.
The better the signal, the taller the light source, and when the light source is very weak or short, so is wifi signal.
Hope you enjoy the video, it one of those things that makes you say, how can they think of this?
What do you think of this? Let me know in the comment section below!

